934 days ago
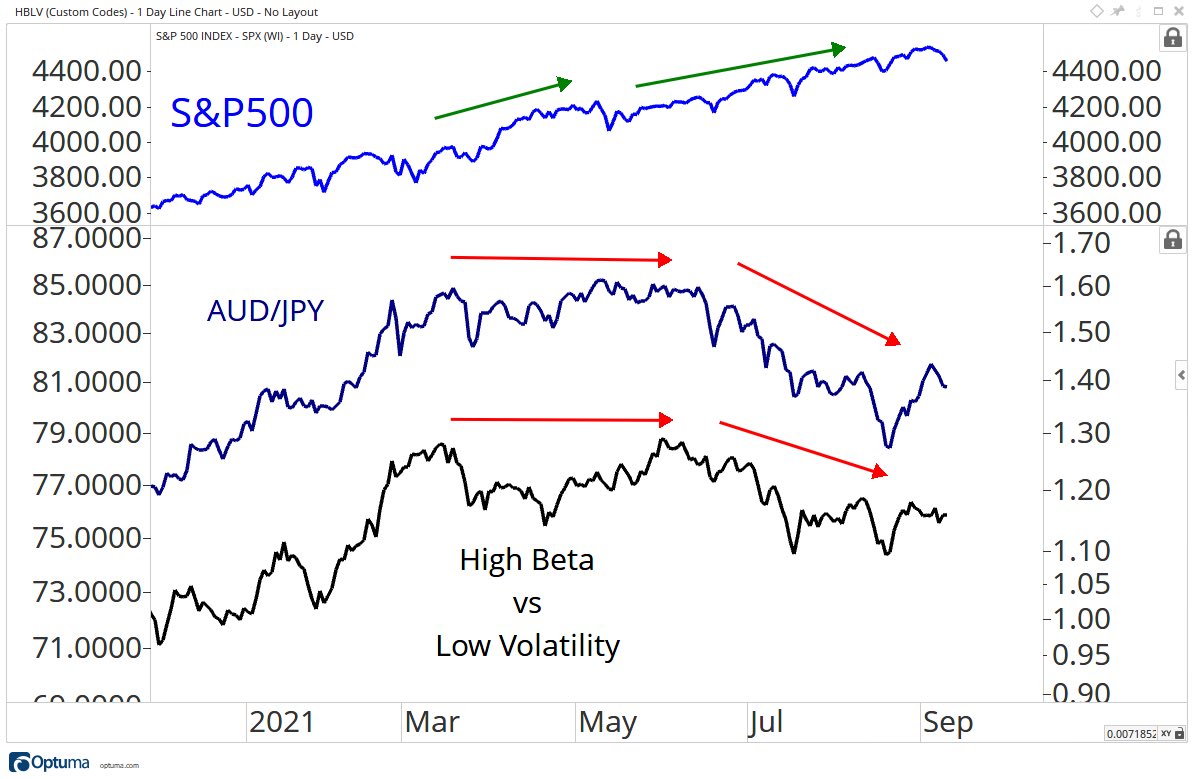
S&P 500 vs other market prices representing risk
The S&P 500 keeps going while other price signals in the stock and currency markets rollover. Do we get a catch up or catch down?
934 days ago
The S&P 500 keeps going while other price signals in the stock and currency markets rollover. Do we get a catch up or catch down?
937 days ago
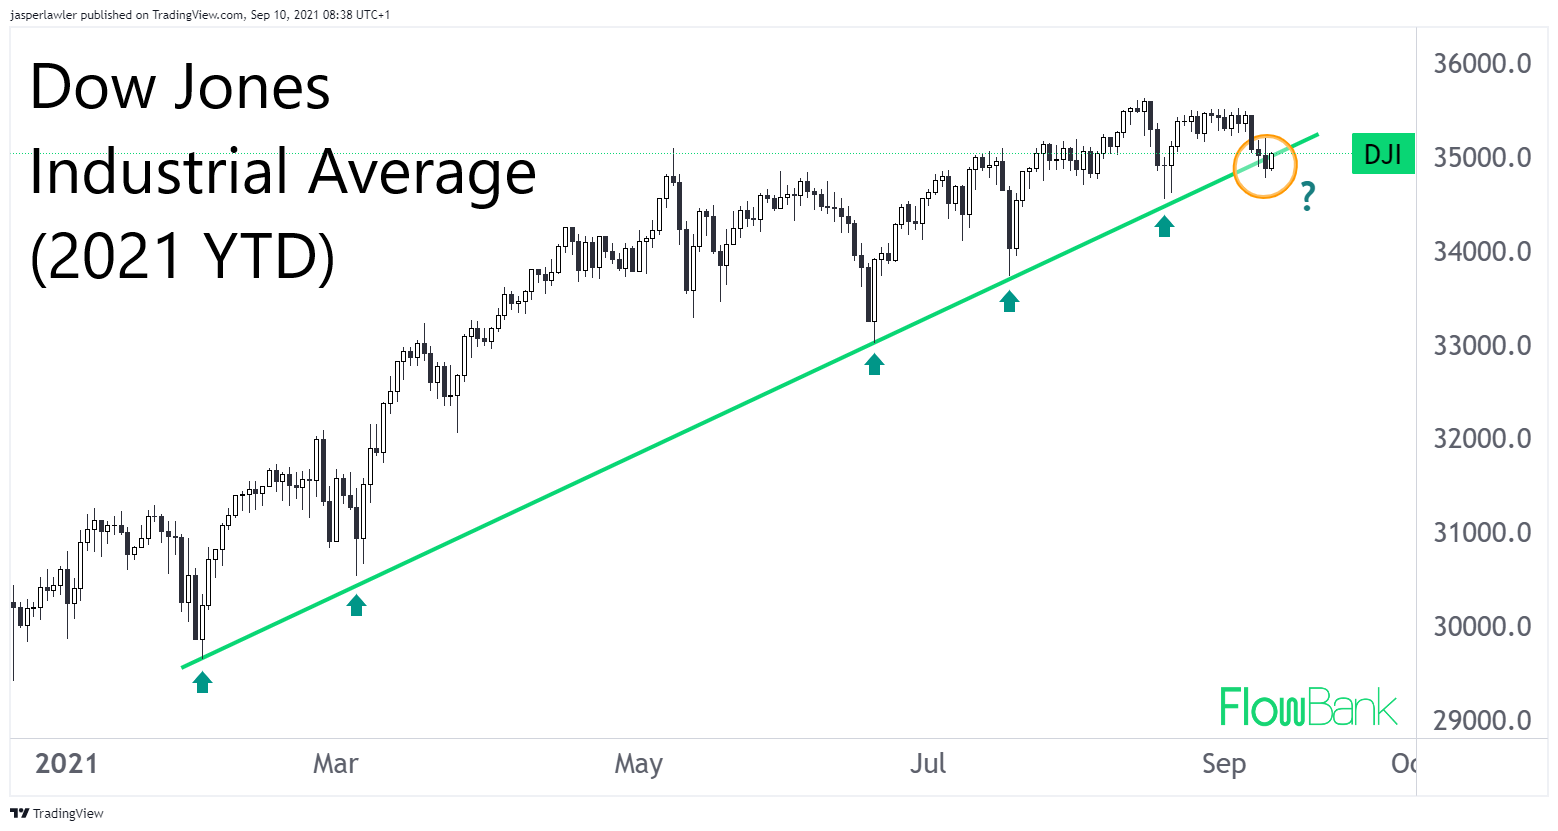
An uptrend line connecting the lows since the start of 2021 has just been broken temporarilly for the first time. Even if the weakness doesn't follow through straight away, its a sign of weakening momentum according to technical analysis.
961 days ago
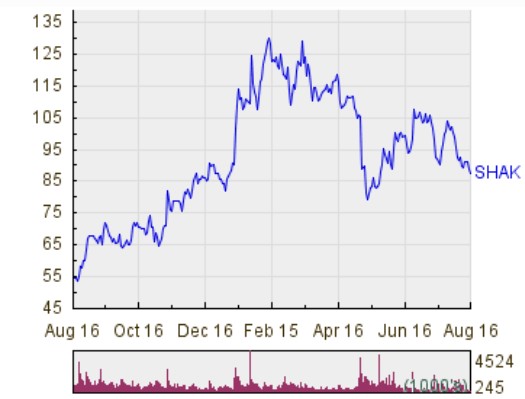
shares of Shake Shack entered into oversold territory, hitting an RSI reading of 29.0, after changing hands as low as $86.03 per share. By comparison, the current RSI reading of the S&P 500 ETF (SPY) is 60.6. A bullish investor could look at SHAK's 29.0 RSI reading today as a sign that the recent heavy selling is in the process of exhausting itself, and begin to look for entry point opportunities on the buy side. Source: Forbes
972 days ago
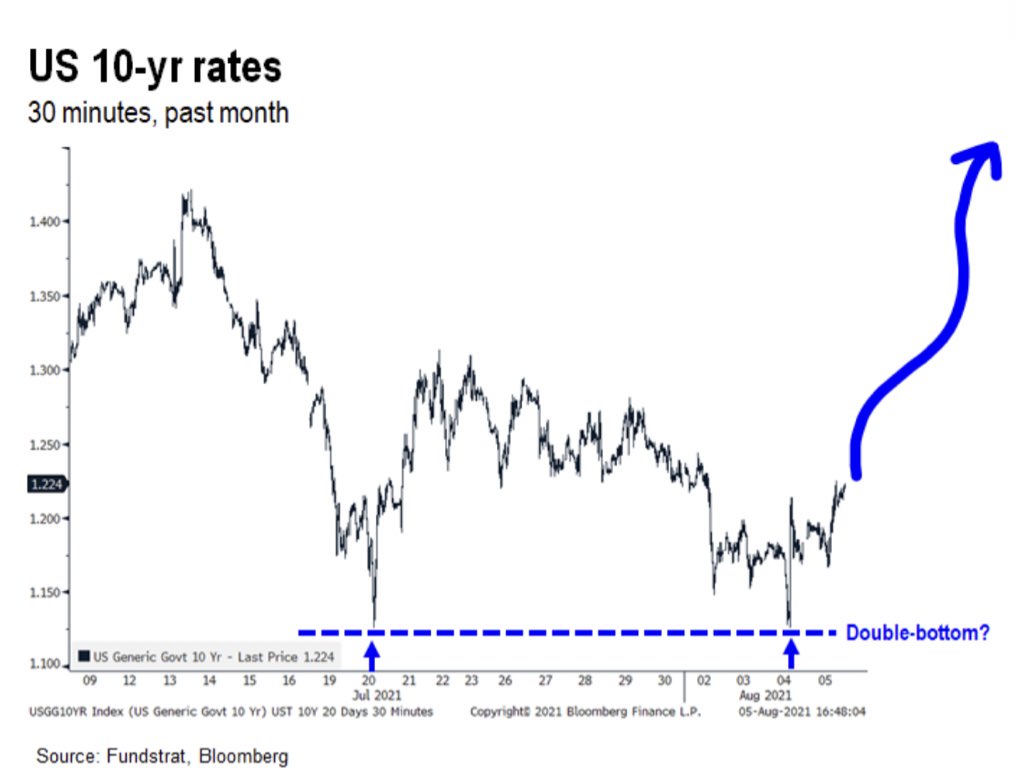
The classic chart pattern could be forming in the Treasury market - a confirmation is only when the neckline is broken.
973 days ago
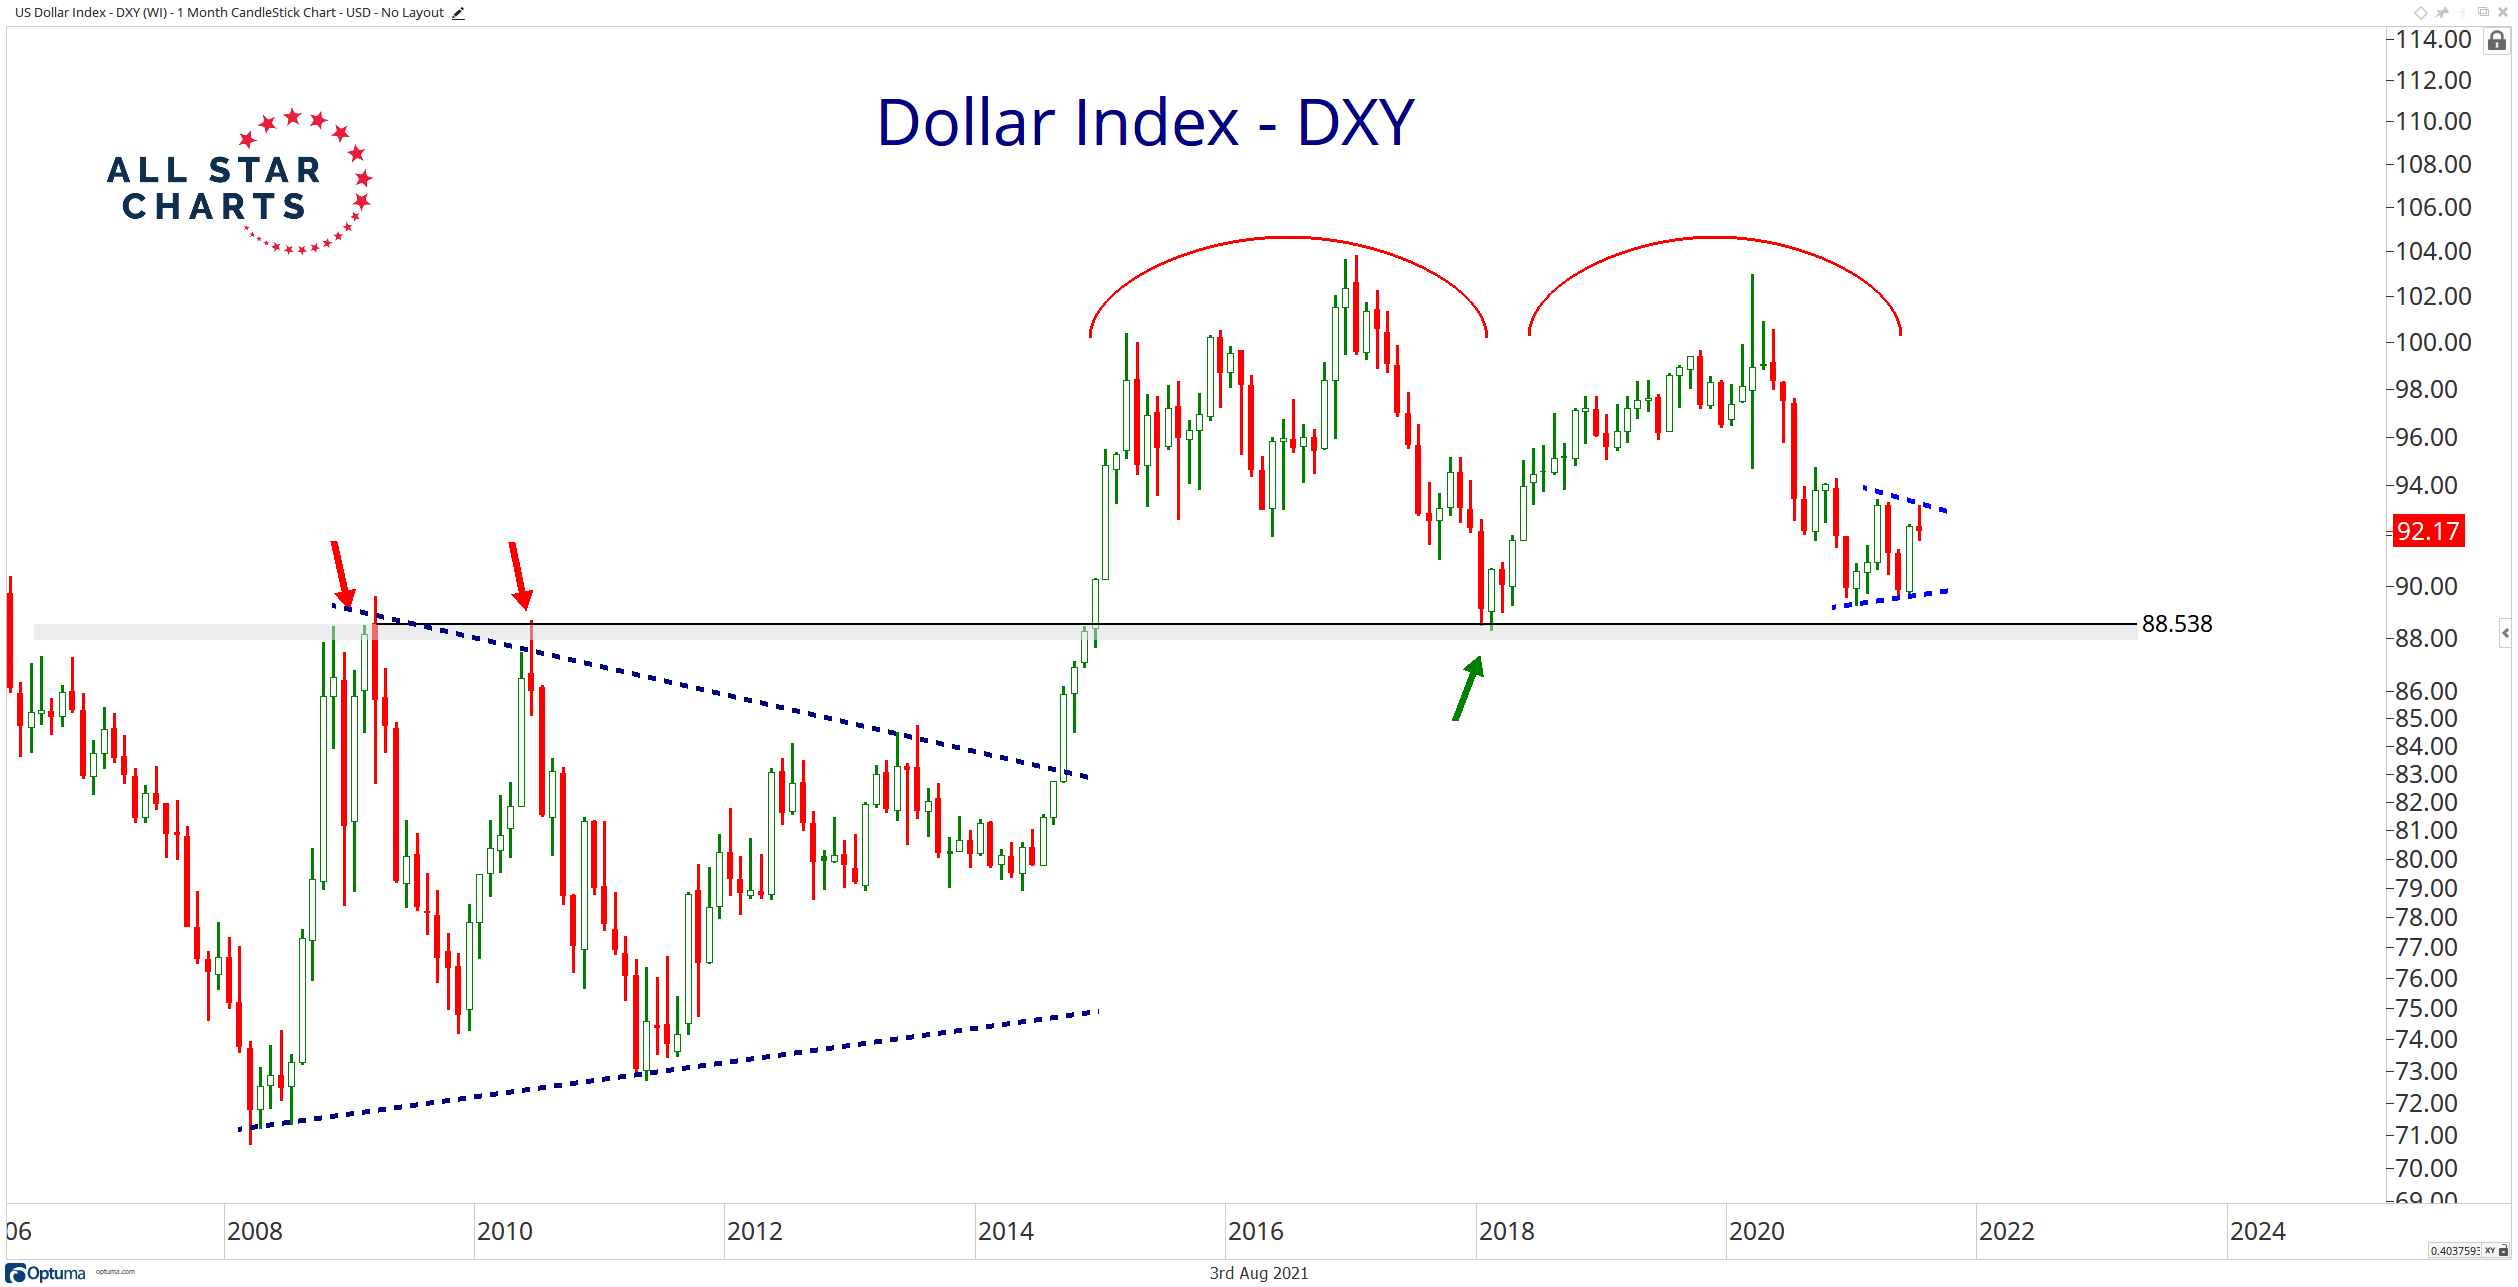
Was that it for the recent bounce in the US dollar? We continue to hold our longer-term view that the US dollar is forming a 6-year double top, so it makes sense to see this weakness.