FlowBank

848 days ago

#Tesla : #China Nov. sales slightly disappoint #EVs $TSLA #Trading

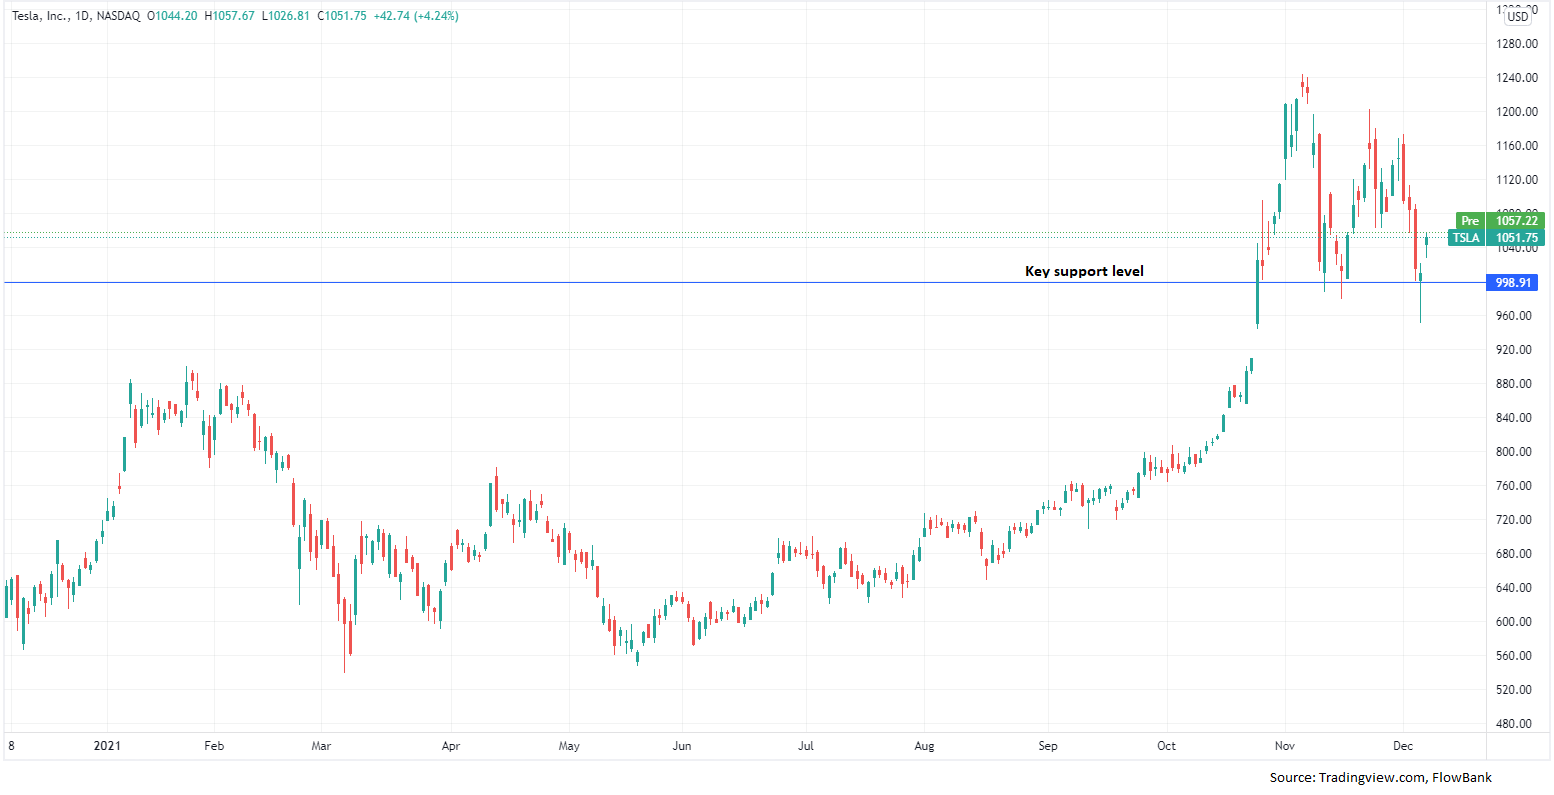
Tesla China November sales per CPCA were 52.9k vs 55-60k expected. Exports totaled 21.1k vs 31.7k for domestic sales. Record for domestic sales, but exports were lighter than expected. The pandemic most likely continues to present challenges for supply-chains, Tesla included. Traders will be keeping an eye on key support level of $1,000 for $TSLA stock. Amid the market wide sell-off, Tesla stock has corrected together with competitors Rivian and Lucid. Massive valuations for these pure EV companies continues to be highly debated amongst investors. Pre-market Tesla stock is pressured -1.6% at $1,035 versus +0.5% for Nasdaq 100 futures.

#Stocks #Technical Analysis

849 days ago

#NASDAQ100 remains in an uptrend #NDX #NASDAQ #trading #TechnicalAnalysis #stocks $QQQ

Technical analysis reveals Nasdaq 100, the tech heavy indice remains in a strong technical uptrend. Pre-market advance of +2% suggests sell-off is behind us as investors are re-positioning for a December-January 2022 rally, in what is usually a very favorable period of the year for stocks. Nasdaq100 held well in the sell-off as investors view the mega cap tech stocks as less vulnerable than emerging new tech players due to their high profitability, strong balance sheets, and typically lower price earning ratio multiples. 

#Technical Analysis #Technology

850 days ago

Bitcoin caught off-guard in the risk-off trade with wild swings.

Bitcoin fell from ~USD67,800 on 12 November to now sitting at USD47,500 (drawdown of approx. 30%!) Investors sold risky assets across the board in a rush to raise cash. Bitcoin, this time around, did not play its role as a hedge. Extreme risk-aversion and lower prices triggered more selling. Technical analysis snapshot: According to Relative Strength Index (RSI, 14 days) Bitcoin/USD is slightly oversold, hitting an RSI level of 30. There is support with Bitcoin still above its 200-day moving average. A rebound would confirm resumption of upward channel.

#Technical Analysis

932 days ago

Back to the familiar 50 DMA

The S&P 500 is again testing the moving average that has acted as support for mosto f 2021.

#Technical Analysis
Back to the familiar 50 DMA

934 days ago

Bitcoin readying a bullish 'Golden cross' pattern

The most widely-watched moving average crossover signal in technical analysis. It shows the short term trend (50 DMA) leading the longer term trend (200 DMA) higher and back into an uptrend.

#Technical Analysis
Bitcoin readying a bullish 'Golden cross' pattern
bg_newsletter