680 days ago
#Nasdaq 100 Selloff deepens, opportunity? #stocks #trading #technicals #tech #crypto
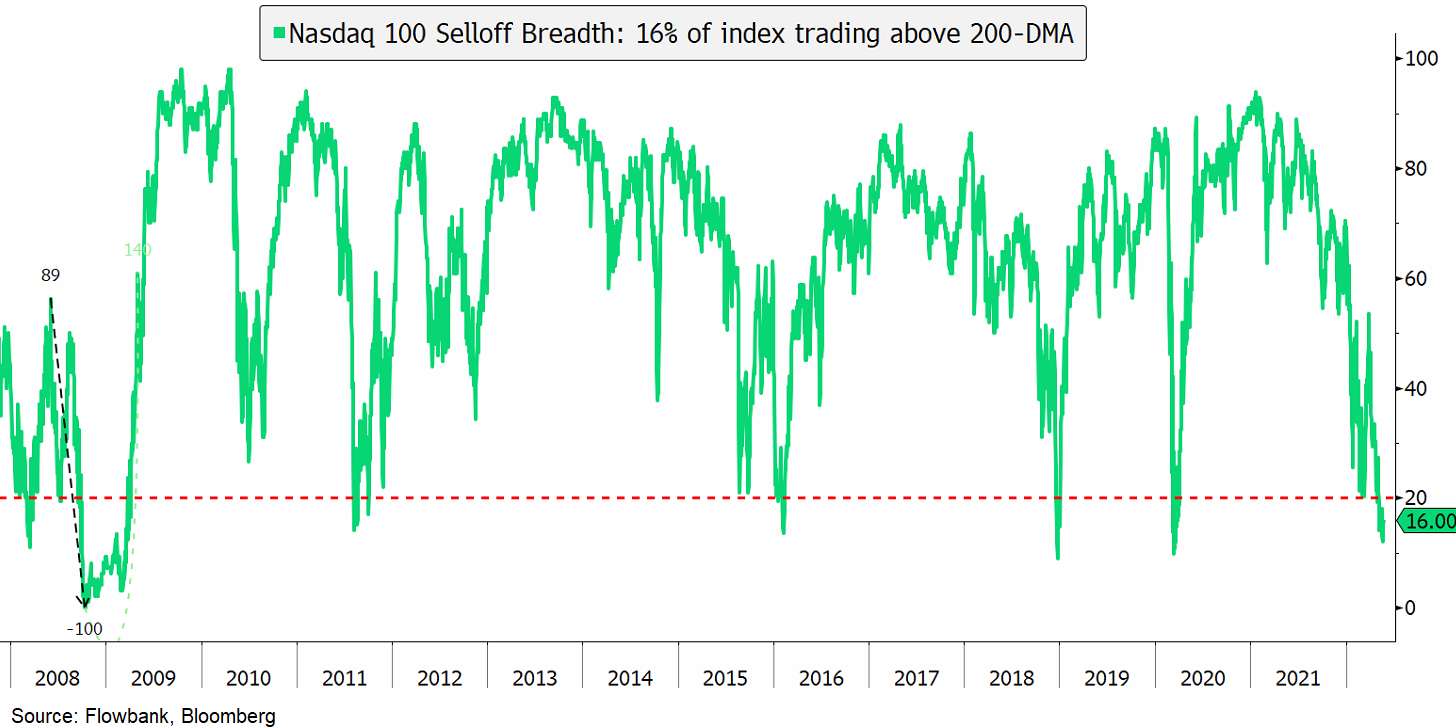
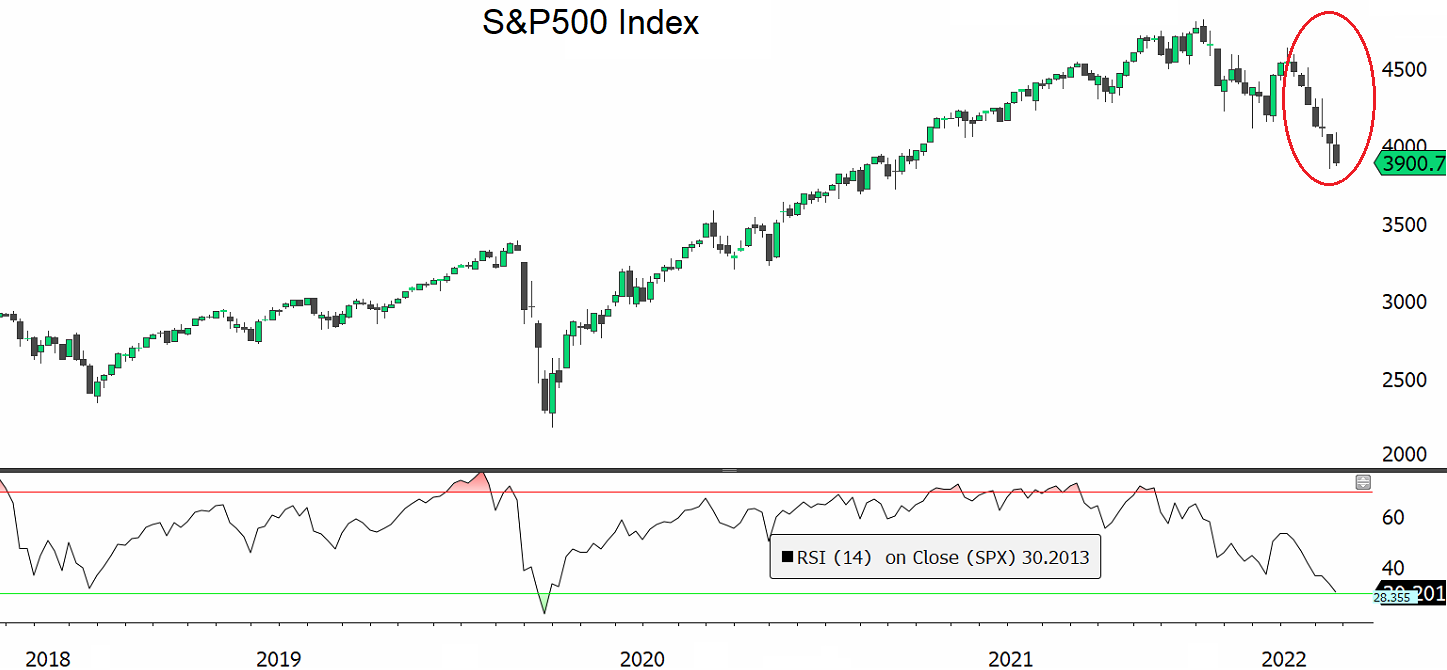
The Nasdaq has reached extreme 'oversold' levels with only 16% of the index's stocks now above their 200-day moving average. The last time this indicator was this oversold was in the midst of the Covid-19 panic in March 2020, the Fed policy mistake scare in December 2018, and during the 2008 selloff. The indicator is not a sign that markets will bottom at current levels, but it suggests stocks have suffered a rapid de-rating in valuation multiples, together with many investors reducing positions. Selling exhaustion could follow, but stocks have suffered severe 'technical' damage. Looking at the relative strength indicator (30-day RSI) it seats below the March 2020 and December 2018 selloff. Investors are worried that growth should dramatically slow amid tighter monetary conditions, the war in Ukraine, and China's lockdowns further deteriorating the outlook. However, given the recent warnings from corporate on worsening conditions and rising costs, traders are quickly cutting fed rate-hike bets. It may be too soon to tell, but growth still appears resilient, despite what headlines could suggest.