1245 days ago
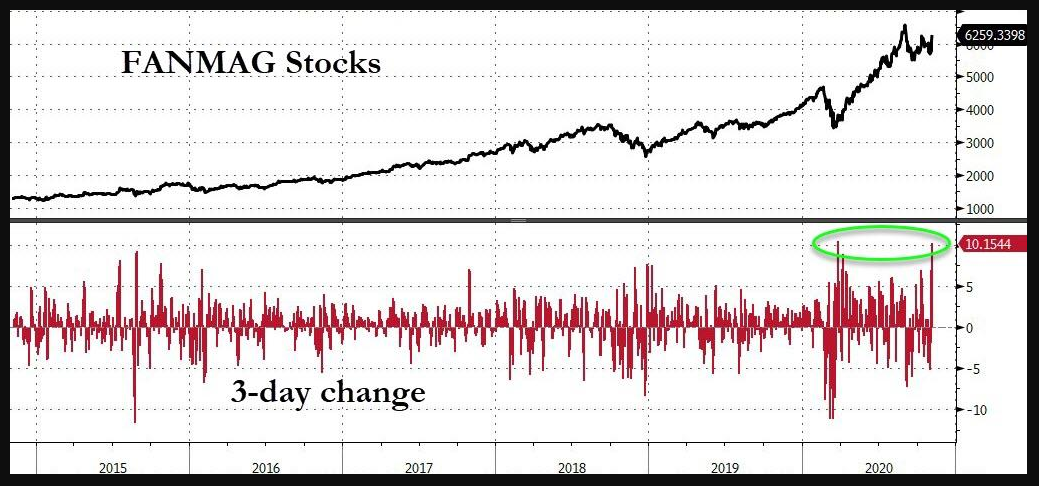
This has been the strongest 3-day rally for FANMAG stocks ever (FB, AMZN, NFLX, MSFT, AAPL, & GOOG), up close to 10%...
Source: Bloomberg, www.zerohedge.com
1245 days ago
Source: Bloomberg, www.zerohedge.com
1245 days ago
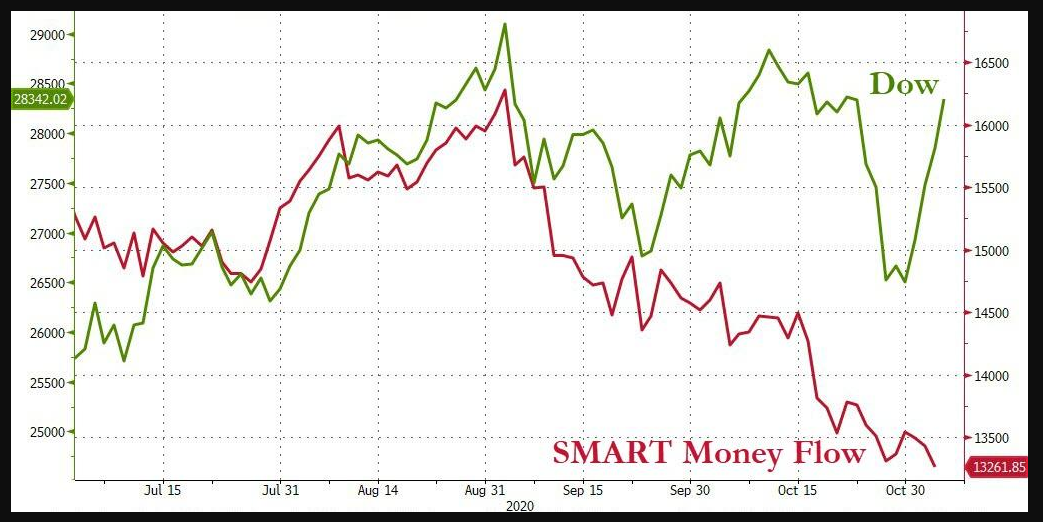
Dow Jones vs. SMART Money Flow (source: Bloomberg, www.zerohedge.com)
1245 days ago
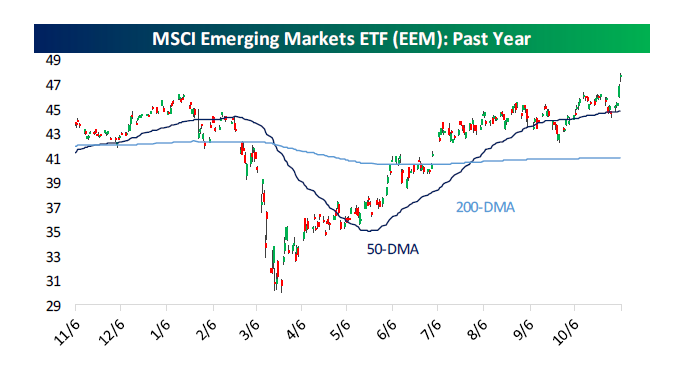
China has been a strong driver. Chart shows EEM ETF (iShares MSCI Emerging Markets) - source: Bespoke
1246 days ago
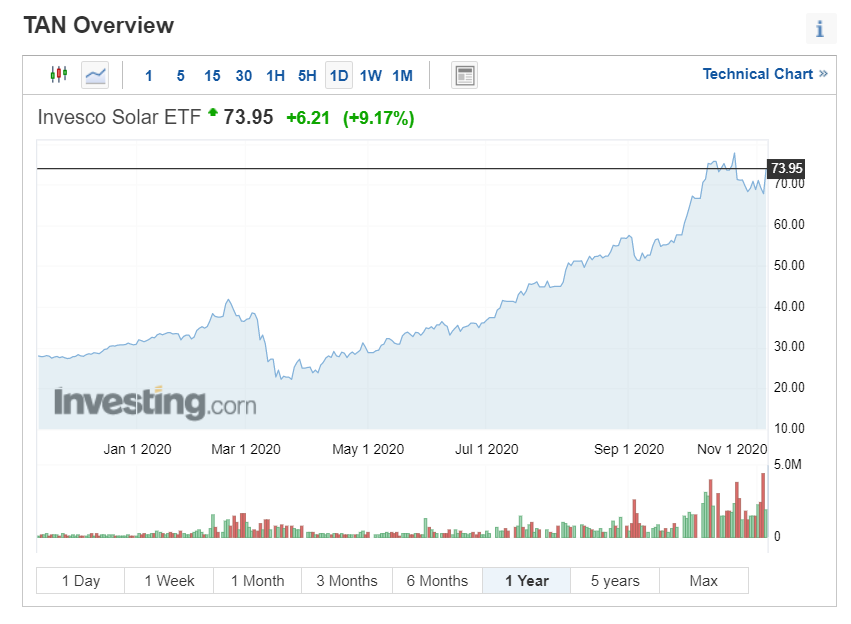
While Solar stocks endured a sharp pullback the day after the election, they are bouncing back strongly today. The Invesco Solar ETF (TAN) is up nearly 10%. These are today's performance of some well know solar names: JKS +20%, ENPH +12%, DQ +12%, RUN +8% and FSLR +6%.
1246 days ago
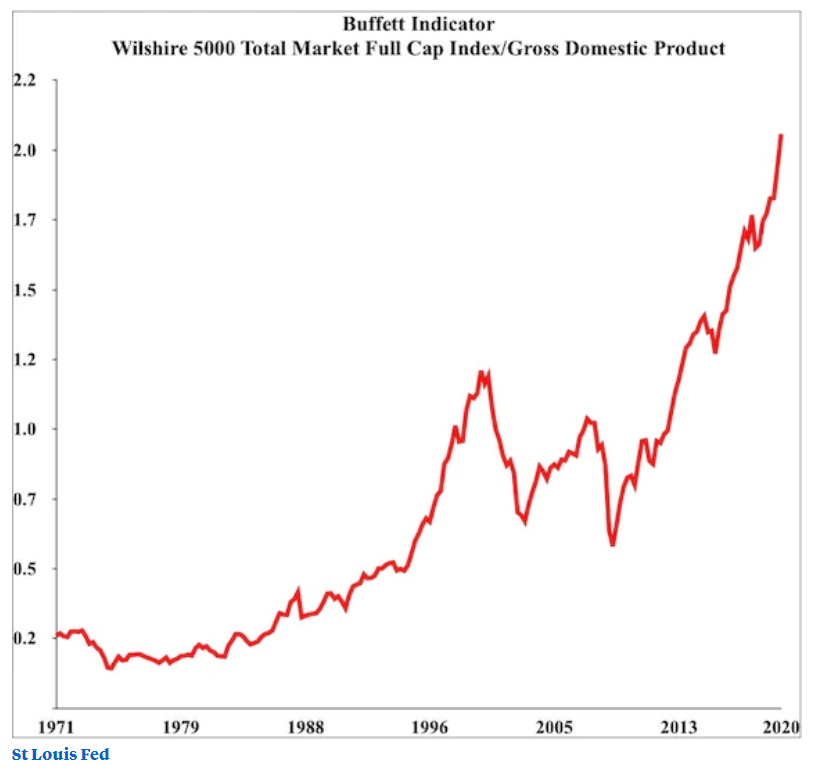
Warren Buffett's preferred market gauge is nearing a new high, indicating stocks are overvalued and could tumble in the coming months. The "Buffett indicator" takes the total market capitalization of a country's stocks and divides it by quarterly GDP, in order to compare the stock market's valuation to the size of the economy. The current reading is at 168%, which is close to all-time highs. The chart below is the St Louis Fed's version of the Buffett indicator (both market cap and GDP are indexed to the fourth quarter of 2007) - source: Markets Insider