1211 days ago
It's been quite a ride for small-cap stocks this year....
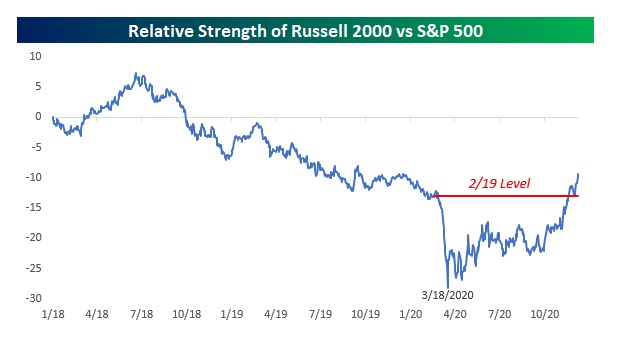
The chart below shows the relative strength of the Russell 2000 (small caps) versus the S&P 500 (large caps) since the start of 2018. Heading into the pandemic, underperformance on the part of small caps was nothing new, but just as the pandemic accelerated a lot of trends already in place, it also exacerbated the underperformance of the small caps. By March 18th, the Russell 2000 bottomed in terms of its performance relative to the S&P 500, but the downside move which lasted only a month took a lot longer in the opposite direction as it wasn't until eight months later that the relative strength of the Russell 2000 versus the S&P 500 rebounded back to its level from 2/19. Since erasing all of its post-2/19 losses, though, small caps have continued to outperform - Source: Bespoke